

Uncategorised
By Ami Levin, SQL Server MVP
The Background
In Part I of this article, we discussed how Qure Profiler came to be, and how it can come to your aid whenever you need to compare two production database workloads. We elucidated the simplicity of the various filtering, grouping and sorting controls that allow you to create comparison views to suit your interests. We also defined the differences between controlled and uncontrolled workloads. Although I’m sure you all remember the distinction, we offer it to you here again as a door into Part II:
Controlled Workloads contain an identical set of SQL commands and are replayed under two different conditions. Usually the testers modify only one dimension of the environment between replays. They may be evaluating, for example, a code change, a server upgrade or a different piece of hardware. Using Controlled Workloads offers one means to achieve an apples-to-apples comparison.
Uncontrolled Workloads contain a similar but non-identical set of SQL commands. When you capture two different sets of traces in production for example, these workloads usually vary with regards to which SQL commands are executed, which parameters they use, how many times they are executed, and so on. This is to be expected in a production environment, because transactions occur as changing business needs dictate.
Controlled Workloads were the focus of Part I. Now it’s time to dive into the deep waters of Uncontrolled Workloads.
The Challenge
Handling dissimilar workloads has several aspects. But in its basic essence, it involves filtering out events from one or both workloads that are considered unqualified for comparison, based on the comparison requirements. Since we feel this (like most things in life) is best explained with an example, let’s consider the following dissimilar workloads:
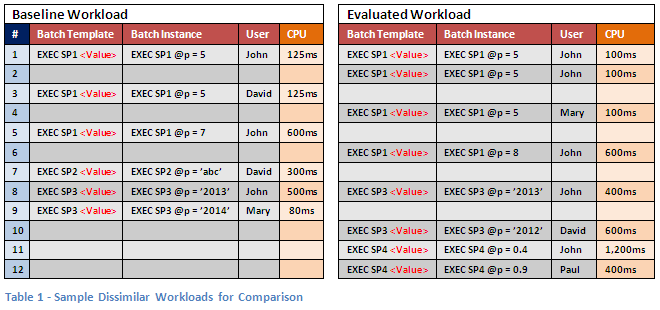
- NOTE: The empty rows were included for easier visual identification of similar events.
As can be easily seen in the above example, there are various degrees of dissimilarity. Some events, such as the events in row #1, differ only in resource consumption (resource consumption is here represented by CPU time, but can be any resource measure - Duration, Reads, Writes, etc). Differences in resource consumption are what we are actually trying to compare, so this type of difference is expected (and if your database improvements went as planned, welcomed).
In the two events in row #1, no difference is seen in the other dimensions (represented here by Batch Template, Batch Instance and User, but can be any dimensions) so the two events are considered fully similar in this particular comparison view. In fact, row #2 in the evaluated workload is also considered fully similar because it too shared the Batch Instance EXEC SP1 @p=5 and User John. However, this means that doing a ‘straight forward’ comparison of these workloads will result in a comparison of one event from the baseline to two events in the evaluated workload. Is this really what you want to compare? Don’t answer this question just yet.
Identifying fully similar events is easy enough, but what about other, somewhat ‘less similar’ events? Which ones should we consider qualified for comparison and which ones should we filter out?
The most obvious example of an event that cannot be matched is the last event on row #12. None of the event dimension values in the evaluated workload exist in the baseline workload. Nowhere in the baseline will you find the EXEC SP4 <Value> Batch Template, so obviously you won’t find the EXEC SP4 @p=0.9 Batch Instance. We also find no event from User Paul. Therefore, no matter which dimensions we select for matching, row #12 will have no matches in the baseline. The same is true in the reverse direction: some baseline workload events may exist, for which no matching dimension values can be found in the evaluated workload. Remember that resource metrics such as CPU are not considered when identifying qualifications for matching. Events without matches rarely add value during workload comparisons; the rare case in which they do add value is described later in this article.
The last level of dissimilarity consists of events found in both workloads that share only some dimension values in common. For example, see row #3 in the baseline workload. If we attempted a match using the Batch Template dimension only, row #3 will be matched with rows #1, #2, #4 and #6 (and grouped with rows #1 and #5). If we use both Batch Template and Batch Instance dimensions, we’d find matches only with rows #1, #2 and #4 (and a “grouping partner” only with row #1). If we attempted a match by the User dimension only, row #3 would be matched with row #10 (and grouped only with row #7). But if we attempted to match row #3 using all its available dimensions, we’d find no matches in the evaluated workload, and no group partners in the baseline workload.
Before we go and see the actual solutions to these issues, let’s first sum up the potential dissimilarities between our two workloads:
- Events that have all dimension column values in common but (potentially) with a different number of occurrences in each workload
- Events that have only some dimension values in common between the two workloads
- Events that have no matching dimension values in common between the two workloads
The solution
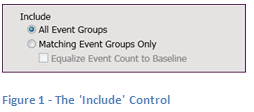
Introducing the Include control; a simple name for a less-than-simple feature.
Comparing all events
The default setting of the Include control is to include All Event Groups. This setting discards no events from either workload. All events are included and grouped according to your Group By settings (reviewed in Part I of this article). If one of the workloads does not have any events in the group to match the other workload, an empty group will be created and all resources will be given values of zero. Comparisons of these artificially created pairs will appear as 100% improvement (e.g. from 100ms to 0ms) or an infinite degradation (e.g. from 0ms to 100ms). In the table below we see a comparison of our sample workloads using the Include setting of All Event Groups, the default Group By view of Batch Template and the default Aggregation Mode setting of Total:
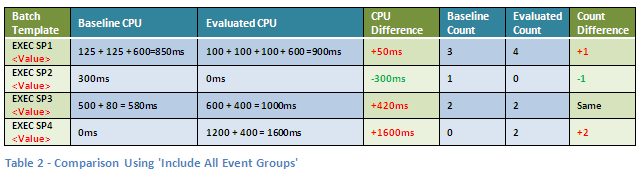
- NOTE: The blue columns are shown here for convenience of explanation and are not displayed in the actual Qure Profiler comparison results.
As you can see, these results report a significant improvement for the Batch Template EXEC SP2 <Value> and a significant degradation for EXEC SP4 <Value> when in fact both results are meaningless in this context, since these Batch Templates are only present in one of the two workloads. For this reason, the Include All Event Groupsoption is generally useful only with controlled workloads, where you know all events are identical. Another use-case is when you need to compare workloads that are different in terms of trace events, but similar in terms of business meaning. For example, if you have rewritten a process’ code from scratch and are trying to compare the performance of the old code with the new one, you may not have a single similar query in the workloads but you know that they still achieve the same business result, therefore such a comparison of dissimilar events makes perfect sense.
Comparing matched dimension events
To filter out these superfluous groups and compare only matching events from the two workloads, you only need to change the Include control from its default setting ofAll Event Groups, to Matching Event Groups Only. Simple enough, isn’t it? Well… there is more to it than meets the eye.
In some cases, you may want to match events only by Batch Template. That means that events that have the same template will be compared against events with the same template but potentially with completely different parameter values. That might make sense if you know that the individual values used for the template are of no consequence, or that you simply don’t have events with identical values. This may be the case if your statement uses current date and time as one of the parameters, and the workloads were captured on different days.
In other cases, comparing by Batch Template alone might not make any sense. For example, a sales report for the past 5 years will probably consume many more resources than a sales report for the past week. In cases like this, where the parameter values used in the query will strongly influence the amount of resources used, you will want to compare only events that not only share the same Batch Template, but also the same Batch Instance which includes the parameter values.
We struggled for a long time to find the best way to provide this functionality in an easy to understand and easy to configure manner. Originally, we planned to provide some basic pre-configured settings which would satisfy the most common use cases. The problem with this solution was that unless you understood exactly what each setting did, you might have received results that could be easily misinterpreted. Eventually, we decided to keep all options open and provide a solution that is so adaptable that allows you to choose any matching criteria. That solution was to base the matching criteria on the Group By settings. It is important to understand that Qure Profiler will match the events based on all of the Group By dimensions you choose, even if they are not visible (expanded) in the workload comparison grid. This means that adding Batch Instance as a second level grouping will still make it part of the matching criteria even if you don’t expand a single template group to view its individual instances. Let’s see how this works in action, using our sample workloads.
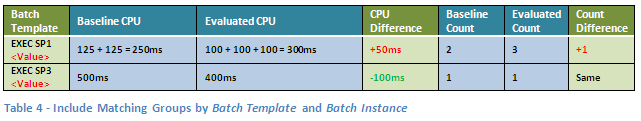
Assuming our Group By setting is simply Batch Template, changing the Include control setting from All Event Groups to Matching Event Groups Only will result in the following comparison:
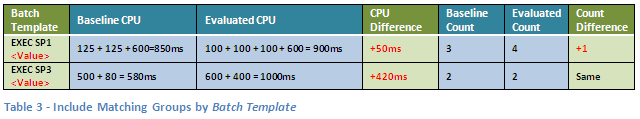
You can see that unlike the comparison in Table 2, the events with the EXEC SP2 <Value> and EXEC SP4 <Value> templates were filtered out and only the events with the matching templates, EXEC SP1 <Value> and EXEC SP3 <Value> were included for the comparison. However, events with different parameter values (differentBatch Instance) were included in their respective Batch Template groups and compared as qualified comparable events. For example, the baseline group for Batch Template EXEC SP3 <Value> consists of parameter values ‘2013’ and ‘2014’ (see rows #8 and #9) and is compared against the respective evaluated workload group that consists of parameter values ‘2013’ and ‘2012’ (see rows #8 and #10).
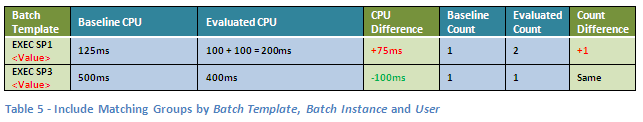
If you want to limit the comparison to events that use the same parameter values, you will need to add Batch Instance to the Group By setting. The results of our sample workload comparison using two levels of grouping - Batch Template and Batch Instance, will result in the following comparison:
This default view of the comparison grid only displays the Batch Template groups, but workload analyzer additionally incorporates the Batch Instance dimension when performing event matching, even though it’s not visible. To see the Batch Instance child groups, expand the parent Batch Template group.
Note that although the CPU and Event Count differences for the first Batch Template group (EXEC SP1 <Value>) above happen to be the same as in Table 3; this is purely accidental as the groups consist of a different number of events. The second group shows a different result for the CPU comparison than the results shown inTable 3 using this more selective comparison mode.
If you want to perform a more restrictive comparison by only comparing events that share not only Batch Template and Batch Instance, but also filter out events that originated from different users, you can simply add the User dimension as a third Group By level, which will provide the following results:
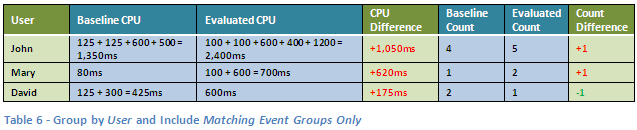
Matching dimensions are not limited to Batch Template or Batch Instance. You can perform comparison matching based on any of the available dimensions. For example, you can simply compare the CPU consumption of your users, regardless of the queries they issued. Setting the Group By control to group by User, and theInclude control to Matching Event Groups Only will result in the following comparison:
Although this is pretty much all you can do with our limited dimensions example workloads, real life workloads with multiple dimensions allows you to go wild with these comparisons and matches. Think of comparing events originating only from particular matching hosts, and/or applications, and/or servers, and/or databases etc. You can easily investigate questions such as “What is the fulfillment department doing differently on Monday evenings that causes our ordering application to slow down?” or “Why is our CEO complaining that the reporting application is a lot slower when used from the conference room than from his office?” I’ll leave you to think of potential answers to these questions.
Equalizing event counts
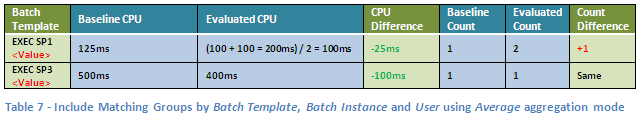
The last piece of the comparison puzzle is compensating for differences not found in the dimensions, but in the number of events that match our comparison criteria. Even in the example in Table 5 above, you can easily see that the comparison for Batch Template EXEC SP1 <Value> might be somewhat misleading since we are comparing a single event from the baseline to two matching events in the evaluated workload. From looking at the comparison as is, you might think that this batch’sCPU consumption has increased compared to the baseline (i.e. performance has degraded), when in fact, this is not true. You might first be tempted to change the aggregate mode to Average instead of Total to compensate for this difference. And you would be right! This would provide the following comparison result:
However, even this more accurate analysis can be improved. How? By helping us see the bigger picture of the workload. Suppose for example that EXEC SP1 <Value>appears over a million times in each workload. Wouldn’t saving 25ms in CPU time a million times make your boss happier than saving 100ms once? Using Averageaggregation will show the latter as being the more significant of the two, which is statistically speaking, correct. This reminds me of what the 19th-century British Prime Minister Benjamin Disraeli (allegedly) said: "There are three kinds of lies: lies, damned lies, and statistics."
This is where the Equalize Event Count to Baseline magic check box kicks in. It allows you to compensate for the differences in event counts by applying a simple formula to factor in these differences in the event counts to all the resource consumption metrics. The formula is:
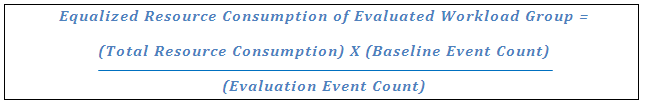
For our example workloads, setting this option will provide the following result:
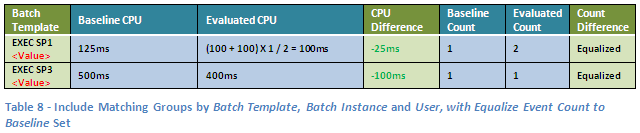
See how this option provides both an averaged comparison and a sense of the overall size of the impact? I’m just kidding… in this case it happens to show exactly the same result as the Average option but if the baseline event count for any of the groups was slightly higher than what we can fit in this example it would look quite differently. Let’s assume a baseline count that consists of exactly a thousand times more events for the EXEC SP1 <Value> Batch Template and a million times more for the EXEC SP3 <Value> Batch Template, without any change in each event’s resource consumption. Whilst the Average view would still show the exact same result as above, the equalized, Total view would show the ‘real’ picture, which would be something like this:
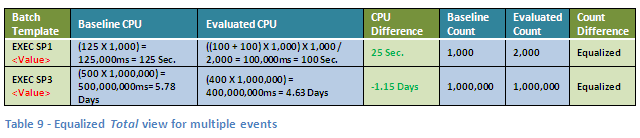
This is the reason we’ve disabled the Average aggregation mode when setting the Equalize Event Count to Baseline on. It is simply meaningless.
I urge you to experiment with the workload comparison capabilities of Qure Profiler for yourself. While this tip does not describe all the functionality and analytical information that are available in the user interface, I think that now you will find the process of comparing two production workloads much easier and clearer. Of course, if you can think of cases where Qure Profiler can’t answer your questions to your full satisfaction (workload performance questions that is…) or if you have a brilliant idea how to improve the tool, or any other feedback you might want to share, please don’t hesitate and send it to This email address is being protected from spambots. You need JavaScript enabled to view it..
By Ami Levin, SQL Server MVP
After Qure Workload Profiler's sister product, Qure Workload Optimizer, had been on the market for a while, some of its customers came to us asking for a way to compare workloads running in production. Here's how that came about: Qure Workload Optimizer, as you may (or may not) know, works in a strictly non-production setting, acting on an offline copy of the production database. It generates and automatically applies various changes that promise to optimize your database's performance, and then empirically measures how much of that promise has been realized. It does this by replaying the copy of the workload before and after the code changes. This actual measurement is extremely accurate when seen in the apples-to-apples comparison performed on the offline copy of your production database, and is a great predictor of what later happens on the real production database.
However, as good as that is, the results are still a prediction.
Once applied to production, these recommended changes can yield somewhat different results, due mainly to potential differences in hardware resources, caching, locking, and execution patterns. So our customers, quite naturally, asked us "How can we tell what the actual impact on the production workload is, after we apply the recommended changes to our production environment?" That reasonable question was the seed idea for a production workload comparison tool, and DBSophic began to work on what later became a major feature of Qure Workload Profiler (QWA).
Although on first sight comparing two workloads might seem like a trivial task, we soon realized that there were a few interesting 'hidden' challenges. Perhaps the most intriguing challenge was how to deal with uncontrolled workloads.
Let's first describe the distinction between controlled and uncontrolled workloads:
Controlled Workloads contain an identical set of SQL commands and are replayed under two different conditions. Usually the testers modify only one dimension of the environment between replays. They may be evaluating, for example, a code change, a server upgrade or a different piece of hardware. Using Controlled Workloads offers one means to achieve an apples-to-apples comparison.
Uncontrolled Workloads contain a similar but non-identical set of SQL commands. When you capture two different sets of traces in production for example, these workloads usually vary with regards to which SQL commands are executed, which parameters they use, how many times they are executed, and so on. This is to be expected in a production environment, because transactions occur as changing business needs dictate.
Our second challenge was to figure out how to provide a clean and pretty way of presenting comparisons of two sets of workloads that can be anything but clean and pretty. As you know if you are a user of SQL Server Profiler, traces can be tailored to monitor any combination of dozens of measurements. The core resource measurements will of course be included: CPU, Duration, Reads, Writes, Row Count. But you as the initiator can also decide to capture any other measurement you'd like. For example: Event Class, Application Name, Host, User, Start Time, SQL: BatchCompleted, SQL:StmtCompleted, Lock:Timeout, SQLTransaction, younameit!
We swallowed hard and braced ourselves knowing that we'd have to make a tool that was as accommodating as the parents of a college-aged daughter who could bring home just about anything. Er, anybody.
Months later, the hard work of creating QWA is complete. You can throw at it any pair of workloads (sets of traces) you'd like, and are able to...
1. Group those events in any way you'd like [Callout 1: Group By]
2. Filter by any combination of columns and values on one or both workloads [Callout 2: Filter By]
3. Sort the resource consumption columns [Callout 5: Resource Columns Sort Mode]
4. More (keep reading)
Taken as a whole, QWA really facilitates examining the differences between two workloads of your choosing, from any angle.
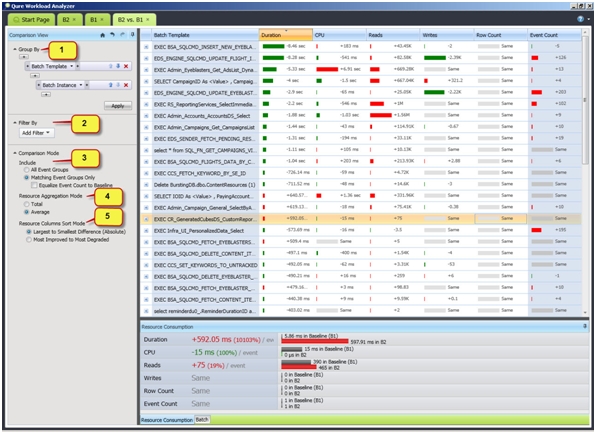
Fig 1 - One of the many views in QWA comparing two workloads
To begin a Workload Comparison, load two workloads into QWA. Note that they must be saved to the same instance of SQL Server to enable comparison. Identify one of them as the Baseline Workload (the "before" snapshot). Identify the other as the Evaluated Workload (the "after" snapshot). QWA's user guide says: "When QWA performs a comparison, it interprets lower resource consumptions in the "after" snapshot as being good and shows that difference as an improvement using a green bar. Similarly, it interprets larger resource consumptions in the "after" snapshot as being bad and shows that difference as a degradation using a red bar. You'd probably hate to get that backwards for the big presentation to the boss".
Fig 1 is a screenshot from QWA, showing just one of its many graphically-oriented views of the comparison. In this example, we see more green than red, indicating improvement. The rows are sorted [See Callout 5: Resource Columns Sort Mode] so that the rows with the largest difference in duration (whether good or bad) are sorted at the top. We can see that the largest changes are good changes. Not until we get to the 14th-largest change do we see a bad change (red). Your other sort option for this control is to display the largest improvements on top and the largest degradations on the bottom. Regardless of sort option, you may have it apply to any of the five core resource consumption columns.
QWA allows you to make your improvement/degradation comparisons based on Total or Average resource consumption for the column you selected. The control that offers this choice is Resource Aggregation Mode [callout 4]. In Fig 1, the average consumption of the batch templates is used. Similarly, it could be the average consumption observed at various process start time hour ranges, or the total consumption of various users.
Earlier, we mentioned the difficulty of comparing not only controlled workloads but also uncontrolled workloads. The control that offers this capability is the Comparison Mode's Include control [callout 3]. It offers the ability to normalize and compensate for variations in two uncontrolled, non-identical workloads. This control deserves an article of its own and therefore we'll leave it for the next edition of InTune.
Till next time...
Leading Companies Worldwide Trust Qure Suite for SQL Server Tuning


