By Ami Levin, SQL Server MVP
SQL Server trace, the most common tool DBAs use to evaluate query performance, provides the 'logical reads' counter on which many DBAs rely for evaluating a query's I/O performance. In this article, we will examine this counter's true meaning and provide examples that prove it can sometimes be quite misleading...
I am sure you have all used SQL traces to evaluate the performance of queries and batches. The most common data columns used for this purpose are Duration, CPU, Writes and Reads. These are in fact the only true performance metrics available for a SQL Server trace event. A common misconception I've encountered in talking with numerous DBAs is that "reducing the number of reads a query performs is an important aspect of improving its performance". Although this may prove to be true in many cases, in this article I want to draw your attention to the fact that "it ain't necessarily so" ? sometimes the opposite is true.
First, we need to understand what a Read really is. Here is a quote from a Microsoft white paper about I/O architecture that clearly defines logical and physical reads: "The I/O from an instance of SQL Server is divided into logical and physical I/O. A logical read occurs every time the database engine requests a page from the buffer cache. If the page is not currently in the buffer cache, a physical read is then performed to read the page into the buffer cache. If the page is currently in the cache, no physical read is generated; the buffer cache simply uses the page already in memory."
It is important to remember that SQL Trace reads are logical reads and not physical reads. I assume that this has to do with the fact that physical reads are common to all currently (and recently) executing batches on the server and therefore are not truly assigned to a specific event, even though they are always triggered by a specific event. Depending on the current content of the cache, the same query or batch may or may not trigger a physical read. Physical reads are the real cause of pain as far as performance is concerned because storage subsystems are unfortunately (still) inherently slow, as opposed to logical reads that occur in the super-fast modern memory modules.
* Physical reads metrics are available when using STATISTICS IO and from SQL Server DMVs.
I think the best way to make my point is by using an example. For this demo I have used SQL Server 2005 SP3 and the "AdventureWorks" sample database.
* As we cannot know in advance what the cache content will be at any given point in time, for the example code, I've explicitly flushed the cache to simulate the worst case scenario of an empty cache.
Let's take the following example query and assume I was given the task of optimizing its performance:
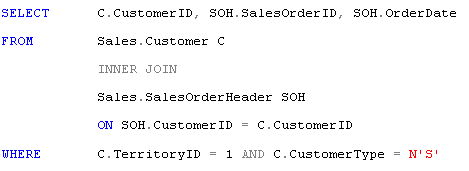
The metrics for this query recorded on my PC using profiler are as follows:
* Note: Numbers below indicate averages of several executions, using a cold cache.
CPU: ~40, Reads: ~840, Duration ~300ms.
The "missing indexes" option in management studio suggested that I add the following index:
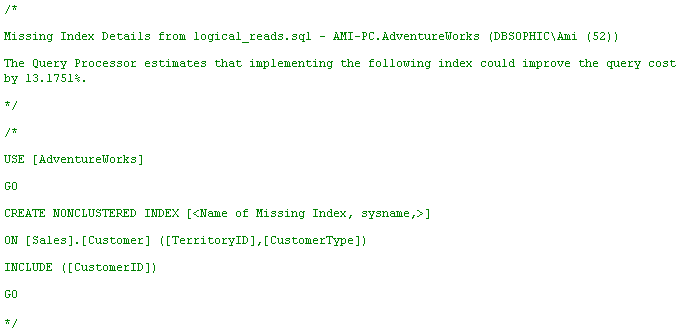
Being an obedient DBA, I immediately obliged, created this index and then executed the same query again. This time, I got the following performance metrics in profiler:
CPU: ~20, Reads: ~4000, Duration ~200ms.
What happened here? Did adding this index improve the performance of the query or worsen it? It seems I have some conflicting information here. CPU and duration seem to have improved significantly but the logical reads have increased by nearly a factor of 5!
To understand what's going on behind the scenes, we must consult the execution plan.
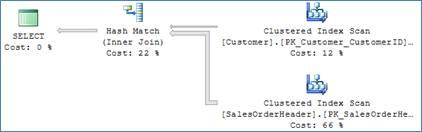
This is the original execution plan of the query before the suggested index was created:
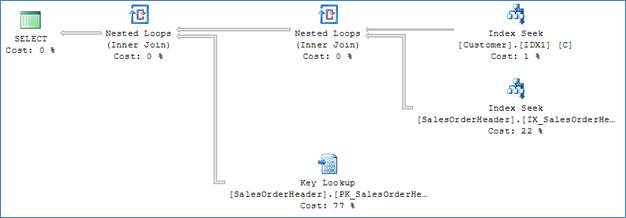
And this is the plan the optimizer chose after the suggested index was created:
In the original plan, the optimizer chose to join the tables using a hash match physical operator. In a hash match, each value of customerID from each of the joined tables needs to be accessed only once. The hash key buckets were built on the CustomerID values from customer's table and then probed by scanning the SalesOrderHeader table. Each page needed to be read only once and all values were retrieved. You can verify this by examining the number of pages used by both tables - the Customer table is ~110 pages large and the SalesOrderHeader table is ~700 pages. This accounts for the ~800 reads we saw in the trace. It is also important to remember that the hash table was probed 31,465 times - once for each key from the SalesOrderHeader table. These probes, which do consume resources, do not constitute a logical read and are not available as separate counters in the SQL Trace and in STATISTICS IO.
After the index was created, the optimizer had many more options to work with. The index on the Customers table allowed efficient seek filtering on both the TerritoryID and CustomerType predicates, resulting in less than a 100 rows that satisfy the filters. The optimizer decided (correctly) that performing a nested loops operator, retrieving the pointers to all relevant rows from the customer table, and then performing a key lookup to retrieve the OrderDate and OrderID columns for the select list would be more efficient. Now, because each row had to be 'index seeked' individually, the same pages needed to be accessed in memory multiple times, each counting as a logical read. As a result, the total number of logical reads increased significantly.
Overall, the query performance significantly improved in several aspects:
- Only the correct subset of rows from the customers table was retrieved, potentially reducing physical IO and locking contention
- The CPU intensive hash functions were eliminated
- The memory footprint for both data and hash buckets was reduced
This example clearly demonstrates that when evaluating a query's performance, you must always consider all aspects of its execution and remember that the logical reads metrics might be highly misleading in some cases. Flushing the buffer cache and using STATISTICS IO instead will provide you with the physical reads counter which, in many cases, more accurately reflects the I/O demands of the analyzed query.
One final thought: Although no more index recommendations were suggested by the query optimizer, can you think of an additional index that could improve this query's performance even more? Take a look at the attached demo code to see the additional index I suggested and its effect on the query's performance.
P.S. Try to execute the demo code on SQL 2008 and you are in for a surprise...