By Ami Levin, SQL Server MVP
SQL Server traces can be a lot of fun to read and analyze in their native form. Natively, you can either use the profiler interface to browse through millions of events, or query a trace table using complex functions. But extracting meaningful data and seeing "the forest for the trees" can often be a challenge. Fortunately, Microsoft and 3rd party vendors have released tools to take some of the fun out of this task. Popular free tools include RML Utilities from the Microsoft CSS team, ClearTrace from fellow SQL Server MVP Bill Graziano, and our very own DBSophic Trace Analyzer. More recently, cloud-based offerings have emerged, including Quest Software's Project Lucy and an online version of ClearTrace AKA TraceTune.
All the above mentioned tools share one significant limitation; they focus on de-parameterizing statements and grouping them by template to pinpoint the top resource consumers. In many cases this is exactly the information you are looking for, especially when performing query-by-query tuning. However, trace events include many other dimensions (or properties) of the workload that provide extremely valuable information. Often the answer to a thorny performance problem lies hidden within these additional dimensions.
Here's an example. A few years ago I was consulting to a large financial company that was experiencing severe CPU bottlenecks on one of their main production servers. The problem had emerged "out of the blue" several days before. Following the normal drill, I collected some trace files, analyzed them using a standard trace analysis tool, and found that one specific procedure was the main CPU consumer. It turned out to be a pretty simple (although long) piece of code. Oddly, when tested from management studio, the procedure ran ultrafast, with a straight forward execution plan, and very low CPU consumption.
To investigate this mystery, I went back to the original trace files, saved them to a table and started to manipulate the grouping using T-SQL queries. I soon realized that although in 90% of the executions performance was great, about 10% of the executions performed several orders of magnitude slower than the norm and were the cause of this particular procedure becoming a major CPU hog. A deeper drill-down revealed that these 10% of 'bad' executions were using non-standard parameter values. These parameters triggered a different code path, for which the cached plan was totally inappropriate. This resulted in huge hash-joins that were overwhelming the CPU.
Having identified the guilty party, it was now time for correctional measures. Forcing explicit recompilation for every execution was out of the question, as this procedure was being executed millions of times per day. After more investigation into the trace events, I discovered another interesting fact - all of those 'abnormal' executions were originating from two specific hosts... Eureka! What was unique about these hosts? I called the system administrator. In turned out that these two hosts had recently been used to test a beta version and their configuration files had been modified. Someone had simply forgotten to reset the configuration once the beta testing had finished. Elementary, my dear Watson. Or is it?
Detective DBA work can be fun. But it is often hard, tedious, and expensive. What I really needed was a tool that would analyze the trace files, but instead of grouping events by their batch template, could also group them by specific parameter values, specific hosts, or all of the above, in a multi-level hierarchy. In other words, what I needed was multi-dimensional analysis.
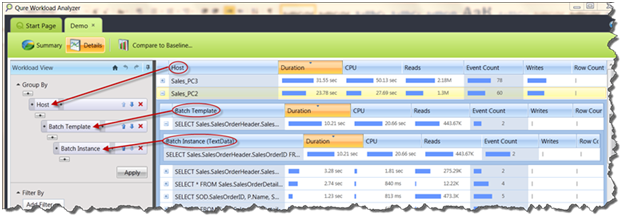
So when we, here at DBSophic, decided to revamp our free trace analysis tool, we made this BI-like capability one of the cornerstones of the new solution. Thus Qure Workload Analyzer was born (and, yes, it's still free!). With Qure Workload Analyzer, solving such performance puzzles is straight forward. If I had had such a tool at the time, I could have simply defined a multi-level grouping, as shown below. First I group by host, then by batch template, and finally by batch instance, to quickly spot the offending parameters.
We hope that you too will enjoy using Qure Workload Analyzer. If you like the solution, feel free to spread the word. If you don't, please tell us how we can make it better (This email address is being protected from spambots. You need JavaScript enabled to view it.).