By Ami Levin, SQL Server MVP
After Qure Workload Profiler's sister product, Qure Workload Optimizer, had been on the market for a while, some of its customers came to us asking for a way to compare workloads running in production. Here's how that came about: Qure Workload Optimizer, as you may (or may not) know, works in a strictly non-production setting, acting on an offline copy of the production database. It generates and automatically applies various changes that promise to optimize your database's performance, and then empirically measures how much of that promise has been realized. It does this by replaying the copy of the workload before and after the code changes. This actual measurement is extremely accurate when seen in the apples-to-apples comparison performed on the offline copy of your production database, and is a great predictor of what later happens on the real production database.
However, as good as that is, the results are still a prediction.
Once applied to production, these recommended changes can yield somewhat different results, due mainly to potential differences in hardware resources, caching, locking, and execution patterns. So our customers, quite naturally, asked us "How can we tell what the actual impact on the production workload is, after we apply the recommended changes to our production environment"? That reasonable question was the seed idea for a production workload comparison tool, and DBSophic began to work on what later became a major feature of Qure Workload Profiler (QWA).
Although on first sight comparing two workloads might seem like a trivial task, we soon realized that there were a few interesting 'hidden' challenges. Perhaps the most intriguing challenge was how to deal with uncontrolled workloads.
Let's first describe the distinction between controlled and uncontrolled workloads:
Controlled Workloads contain an identical set of SQL commands and are replayed under two different conditions. Usually the testers modify only one dimension of the environment between replays. They may be evaluating, for example, a code change, a server upgrade or a different piece of hardware. Using Controlled Workloads offers one means to achieve an apples-to-apples comparison.
Uncontrolled Workloads contain a similar but non-identical set of SQL commands. When you capture two different sets of traces in production for example, these workloads usually vary with regards to which SQL commands are executed, which parameters they use, how many times they are executed, and so on. This is to be expected in a production environment, because transactions occur as changing business needs dictate.
Our second challenge was to figure out how to provide a clean and pretty way of presenting comparisons of two sets of workloads that can be anything but clean and pretty. As you know if you are a user of SQL Server Profiler, traces can be tailored to monitor any combination of dozens of measurements. The core resource measurements will of course be included: CPU, Duration, Reads, Writes, Row Count. But you as the initiator can also decide to capture any other measurement you'd like. For example: Event Class, Application Name, Host, User, Start Time, SQL: BatchCompleted, SQL:StmtCompleted, Lock:Timeout, SQLTransaction, younameit!
We swallowed hard and braced ourselves knowing that we'd have to make a tool that was as accommodating as the parents of a college-aged daughter who could bring home just about anything. Er, anybody.
Months later, the hard work of creating QWA is complete. You can throw at it any pair of workloads (sets of traces) you'd like, and are able to...
1. Group those events in any way you'd like [Callout 1: Group By]
2. Filter by any combination of columns and values on one or both workloads [Callout 2: Filter By]
3. Sort the resource consumption columns [Callout 5: Resource Columns Sort Mode]
4. More (keep reading)
Taken as a whole, QWA really facilitates examining the differences between two workloads of your choosing, from any angle.
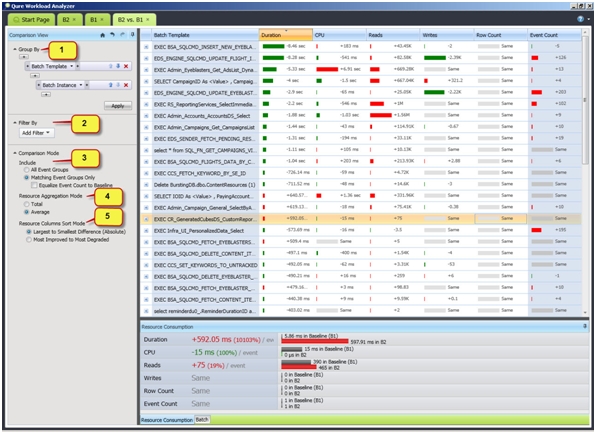
Fig 1 - One of the many views in QWA comparing two workloads
To begin a Workload Comparison, load two workloads into QWA. Note that they must be saved to the same instance of SQL Server to enable comparison. Identify one of them as the Baseline Workload (the "before" snapshot). Identify the other as the Evaluated Workload (the "after" snapshot). QWA's user guide says: "When QWA performs a comparison, it interprets lower resource consumptions in the "after" snapshot as being good and shows that difference as an improvement using a green bar. Similarly, it interprets larger resource consumptions in the "after" snapshot as being bad and shows that difference as a degradation using a red bar. You'd probably hate to get that backwards for the big presentation to the boss".
Fig 1 is a screenshot from QWA, showing just one of its many graphically-oriented views of the comparison. In this example, we see more green than red, indicating improvement. The rows are sorted [See Callout 5: Resource Columns Sort Mode] so that the rows with the largest difference in duration (whether good or bad) are sorted at the top. We can see that the largest changes are good changes. Not until we get to the 14th-largest change do we see a bad change (red). Your other sort option for this control is to display the largest improvements on top and the largest degradations on the bottom. Regardless of sort option, you may have it apply to any of the five core resource consumption columns.
QWA allows you to make your improvement/degradation comparisons based on Total or Average resource consumption for the column you selected. The control that offers this choice is Resource Aggregation Mode [callout 4]. In Fig 1, the average consumption of the batch templates is used. Similarly, it could be the average consumption observed at various process start time hour ranges, or the total consumption of various users.
Earlier, we mentioned the difficulty of comparing not only controlled workloads but also uncontrolled workloads. The control that offers this capability is the Comparison Mode's Include control [callout 3]. It offers the ability to normalize and compensate for variations in two uncontrolled, non-identical workloads. This control deserves an article of its own and therefore we'll leave it for the next edition of InTune.
Till next time...